Statistics & Probability - Practice Set 1
UNIT 4: STATISTICS & PROBABILITY
Practice questions covering descriptive statistics, probability rules, tree diagrams, binomial, Poisson, normal distributions, hypothesis testing (t-test, chi-squared), regression and correlation, confidence intervals, Bayes' theorem, Markov chains, continuous probability density functions, and non-linear regression.
The scores of 9 students: 45, 62, 58, 71, 45, 88, 53, 67, 45. Find:
Answer
(a) 59.3 (b) 58 (c) 45
Data: 12, 18, 21, 23, 25, 26, 27, 28, 30, 31, 33, 35, 38, 42. Find Q1, Q3, IQR, and any outliers.
Answer
Q1=22, Q3=33.5, IQR=11.5, no outliers
A bag has 4 red, 3 blue, 5 green balls. One ball is picked at random. Find:
Answer
(a) 1/3 (b) 3/4 (c) 3/4
The correlation coefficient r = −0.92.
Answer
(a) Strong negative linear (b) r²≈0.846, 84.6% explained (c) No; correlation ≠ causation
Describe the difference between:
Answer
(a) Every member equally likely (b) Population divided into groups, sample proportional from each (c) Every nth member selected
X ~ B(10, 0.3). Find:
Answer
(a) 0.267 (b) 0.383 (c) E(X)=3, Var=2.1
A frequency table: marks 10-20 (freq 4), 20-30 (freq 7), 30-40 (freq 12), 40-50 (freq 9), 50-60 (freq 3).
Answer
(a) 35 (b) 30-40 (c) ≈35.4 (d) Q1≈31.8, Q3≈43.6
Study time (x hrs/week) vs exam score (y): data pairs (2,45),(5,58),(7,64),(8,69),(10,75),(12,80),(14,88),(15,91).
Answer
(a) r≈0.995 (b) y=3.24x+38.1 (c) ≈67.3 (d) Extrapolation — unreliable
Events A and B: P(A)=0.4, P(B)=0.5, P(A∩B)=0.25
Answer
(a) No (b) 0.65 (c) 0.5 (d) Venn: A∩B=0.25, A only=0.15, B only=0.25, neither=0.35
A tree diagram: a box has 5 red and 3 blue balls. Two balls drawn without replacement.
Answer
(a) Tree diagram (b) 5/14 (c) 15/28 (d) 4/7
X ~ Po(3.5). Find
Answer
(a) 0.189 (b) 0.537 (c) 0.275 (d) E=Var=3.5
A teacher claims the mean test score is 70. A sample of 25 students gives x̄=66, s=12.
Answer
(a) H₀:μ=70, H₁:μ≠70 (b) t=−1.667, not significant (c) Fail to reject H₀ (d) (61.1, 70.9)
X~N(μ,σ²). P(X<40)=0.2 and P(X<60)=0.85. Find μ and σ.
Answer
σ≈10.65, μ≈49
Transition matrix: T=[[0.7,0.3],[0.4,0.6]]. Initial state s₀=[0.6,0.4]ᵀ
Answer
(a) s₁=[0.54,0.46], s₂=[0.516,0.484] (b) [3/7, 4/7] (c) λ=1, λ=0.3 (d) n=5 steps
X and Y are independent: X~N(10,4), Y~N(6,9). Let W=2X−Y+3
Answer
(a) 17 (b) 25 (c) 0.274 (d) 0.866
Chi-squared test: a die is rolled 120 times. Results: 1(18),2(22),3(25),4(17),5(16),6(22). At 5% significance level, test if the die is fair.
Answer
χ²=3.1 < 11.07; Fail to reject H₀; die appears fair at 5% level
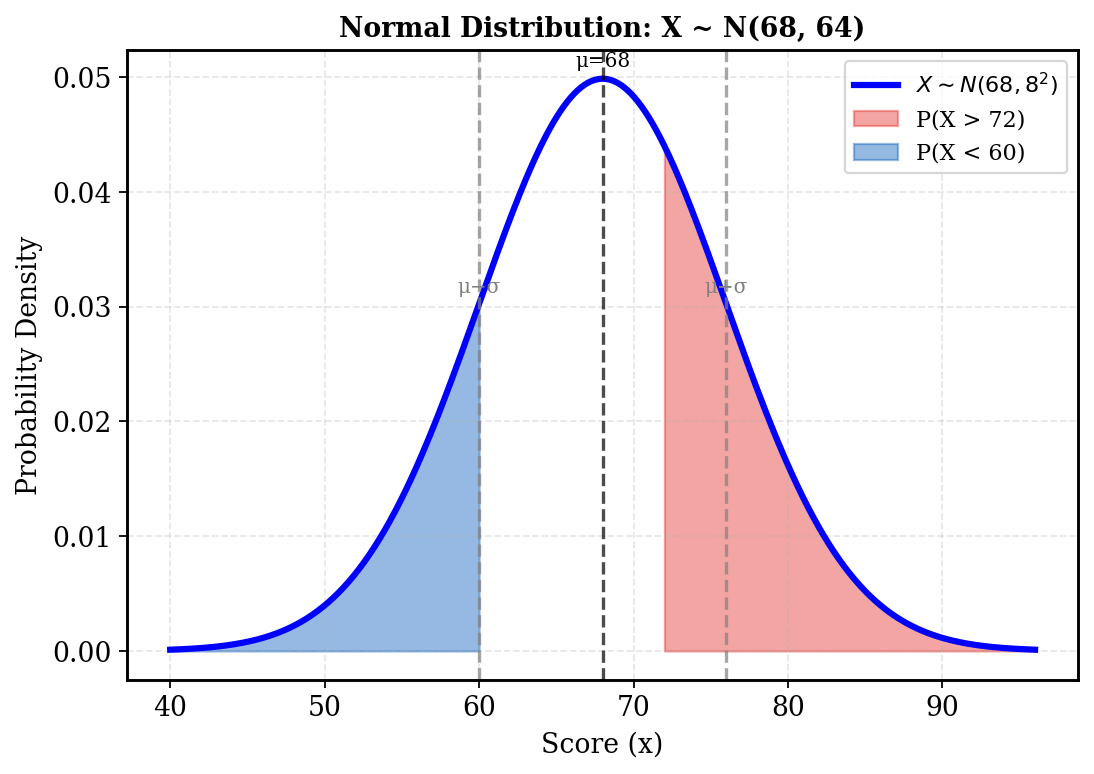
The normal distribution graph shows X~N(68,64)
Answer
(a) 0.309; 0.159 (b) c≈13.2 (c) ≥76.3 (d) ≈0.141
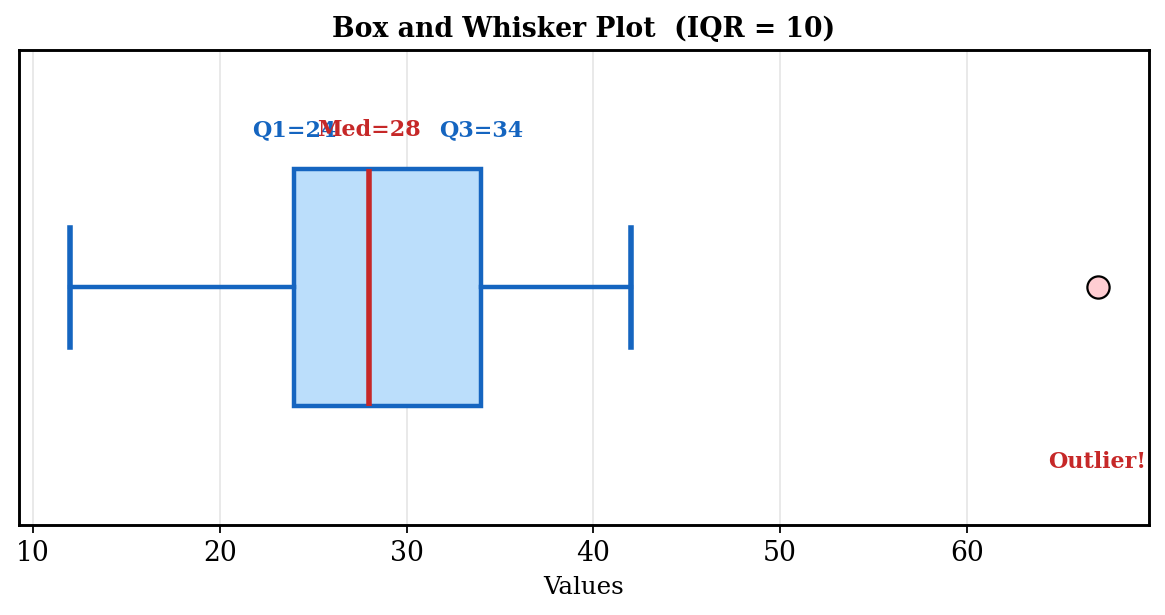
The box and whisker plot shows data with a clear outlier
Answer
(a) Q1=22, Q3=33.5, IQR=11.5, outlier=67 (b) Median better (c) σ≈12.6 (d) Mean drops to 27.4, SD to 7.1
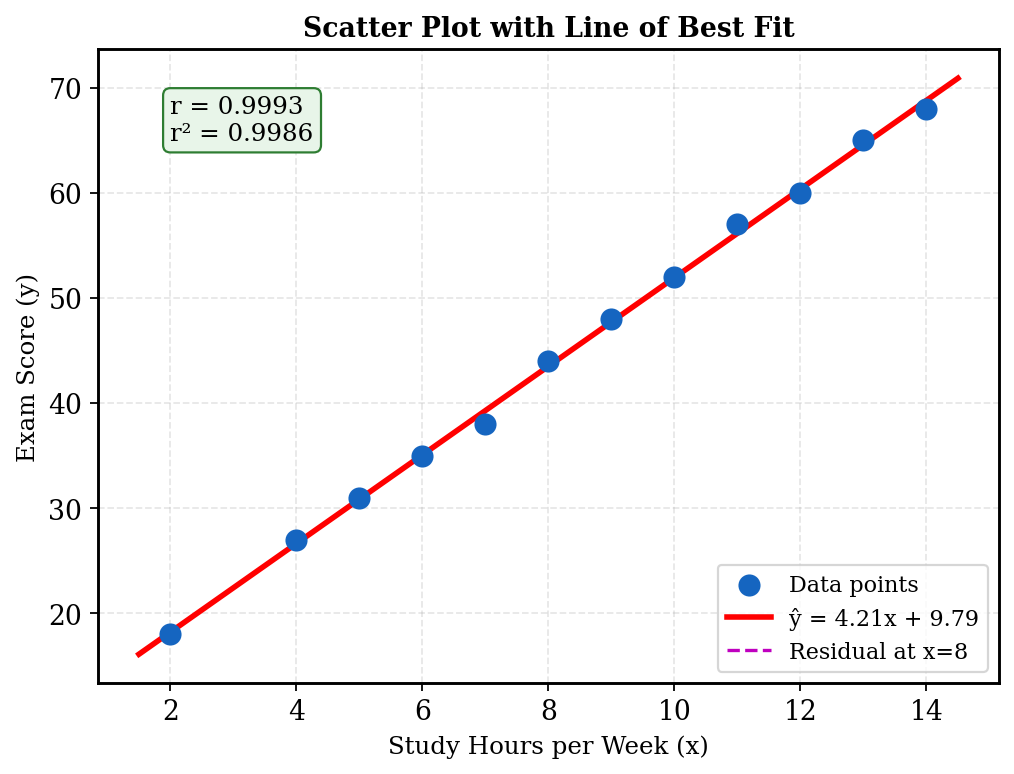
Scatter plot: study hours vs exam score, n=12. The regression line ŷ=3.24x+38.1 is shown with r=0.994
Answer
(a) +3.24 marks/hour; 38.1 baseline (b) 73.7; interpolation (c) residual=+1.8 (d) Reject H₀; significant
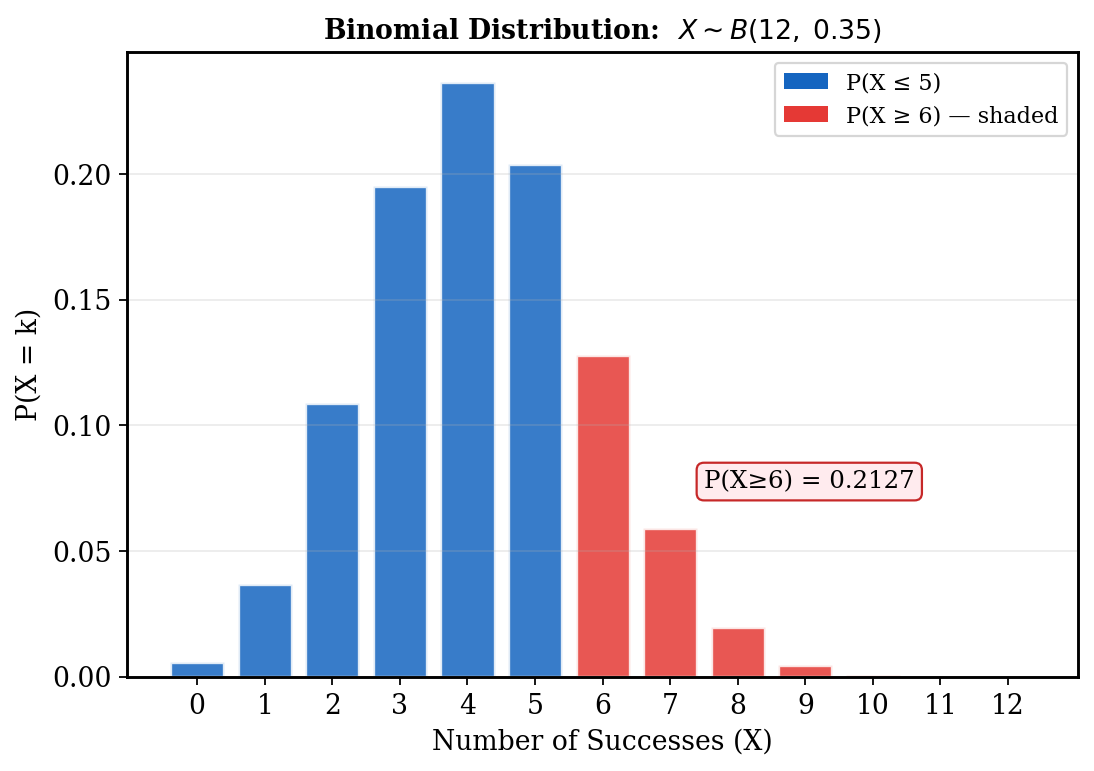
Binomial distribution X~B(12,0.35). The bar chart highlights P(X≥6)
Answer
(a) P(X=6)≈0.128, P(X≥6)≈0.254 (b) Mode=4 (c) E=4.2, Var=2.73, SD=1.65 (d) P(Y=5)≈0.097, E(Y)≈2.86
Continuous probability: f(x) = kx(4−x) for 0≤x≤4, f(x)=0 otherwise
Answer
(a) k=3/32 shown (1 < X < 3) (b) E(X)=2, Var=0.8 (c) 11/16=0.6875 (d) m=2
Confidence intervals and hypothesis: A sample of 40 light bulbs has mean lifetime x̄=1200hrs, s=150hrs
Answer
(a) (1139, 1261) (b) Reject H₀ (c) n≥217 (d) Fail to reject; means not significantly different
Combined probability: Events A, B, C: P(A)=0.5, P(B|A)=0.6, P(B|A')=0.3, P(C|A∩B)=0.8, P(C|A∩B')=0.4, P(C|A'∩B)=0.5, P(C|A'∩B')=0.1.
Answer
(a) 0.45 (b) 2/3 (c) 0.43 (d) 0.744 (e) ≈0.197
Non-linear regression: data suggests model of form y=ax^b. After log transformation: ln(y)=ln(a)+b·ln(x). Data: (x,y): (1,3),(2,8.5),(3,15.6),(4,24),(5,33.7),(6,44),(7,55.8),(8,68).
Answer
(a) Transform done (b) ln y≈0.97+1.50·ln x (c) a≈2.64, b≈1.50 (d) y≈83.5 (e) r≈0.9998